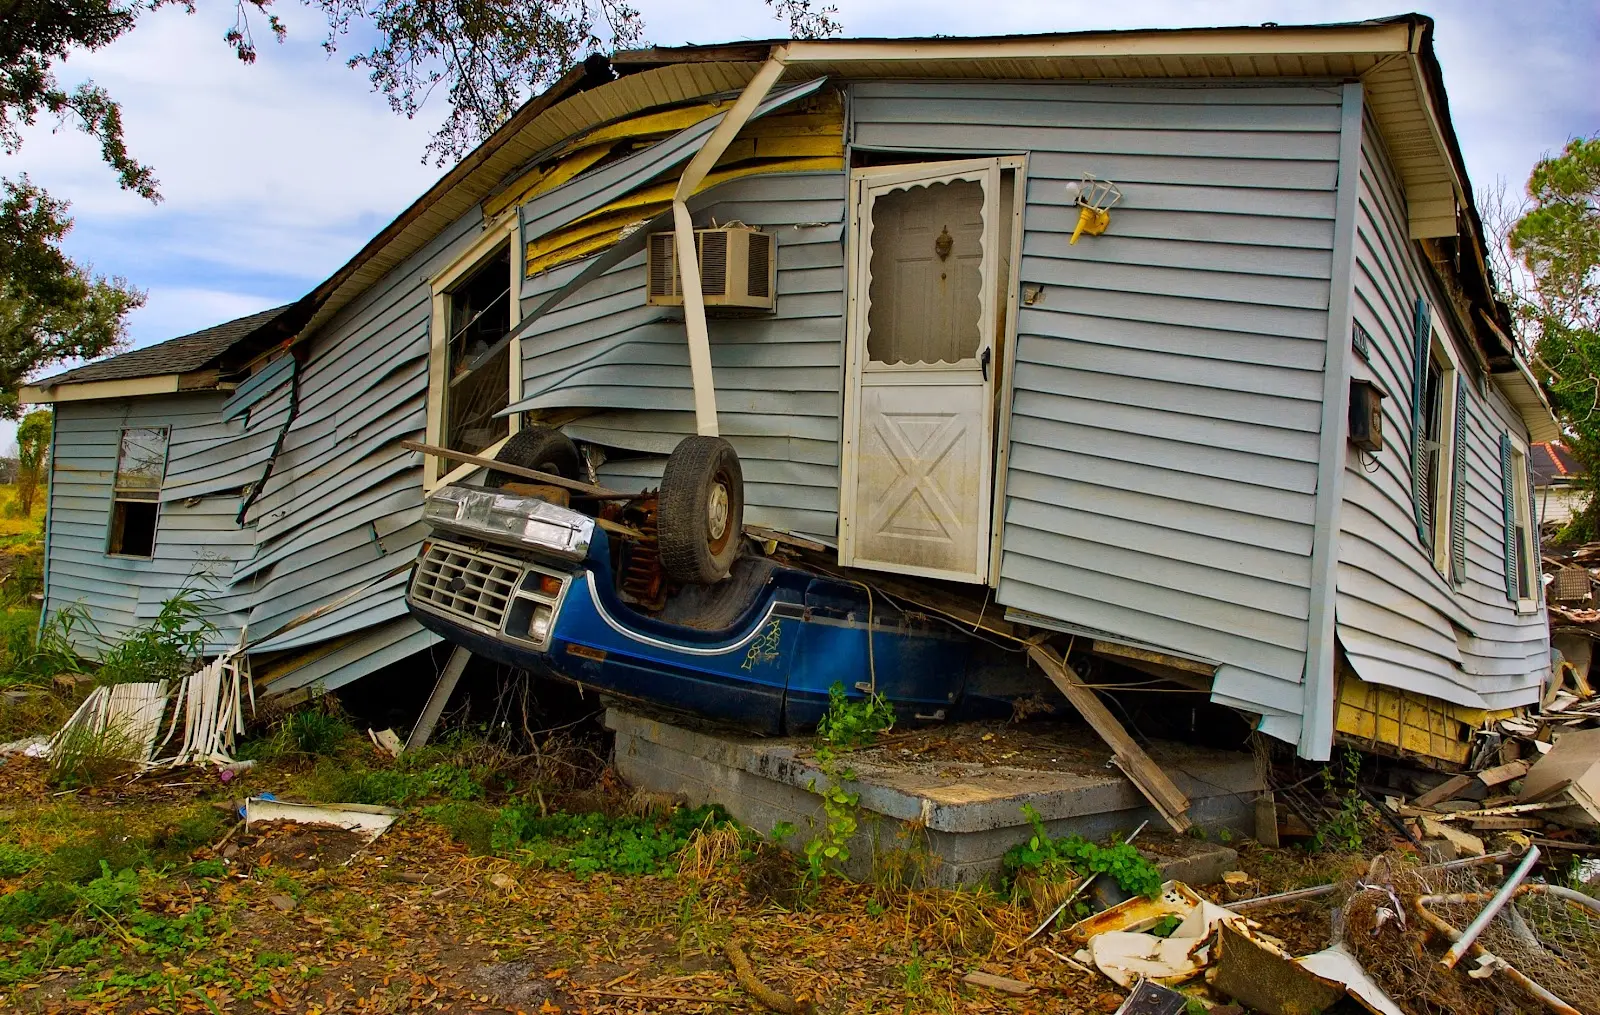
After leaving the entire island of Cuba without power, Hurricane Ian hit Florida on September 28, 2022 with wind speeds only 2 mph short of a Category 5 classification. Second only to Hurricane Katrina in 2005, Hurricane Ian will go down in history as one of the deadliest storms to devastate the continental U.S. this century.
As natural disasters become increasingly destructive, it's vital we find new ways of monitoring these catastrophes and accurately anticipating their damage. By combining the power of GIS and AI, we can.
A New Era In Disaster Management: GIS And AI
In the past, we relied on satellite imagery, airplane surveillance, and drones to gather information about disasters. The problem with this was scale; the technology could only identify damage in relatively small areas, making it difficult to grasp the bigger picture. Luckily, that could soon change with new applications of AI and GIS.
Comparing Pre And Post Storm Imagery
One way this technology is being used is to compare pre-storm and post-storm imagery to identify, document, and categorize damage by severity. Using AI, a team of spatial and environmental analysts at the University of Connecticut used this technique to analyze damage caused by Hurricane Ian when it passed over the Florida peninsula. The AI program flagged areas on post-disaster aerial maps that showed significant changes from pre-storm imagery in yellow. Just five days after Ian hit Florida, their map showed yellow polygons throughout the southern part of the state, identifying damage with 84% accuracy.
Researchers also analyzed destruction based on spectral changes. Areas heavily impacted by natural disasters will typically see differences in how light reflects off the surface (pavement will look different to remote sensors when it is dry versus when it is flooded, for example). By comparing these spectral changes, we can clearly see which areas have been impacted the most.
Predicting Impacts
With the unlimited GIS data available to us, we’re able to predict how devastating the impacts of a disaster will be better than ever before. For example, by adding a GIS layer for population and housing units, we’re able to predict how many people will be displaced, and where that displacement will most likely occur. We can do a similar analysis to predict how critical infrastructure will be impacted as well. You can add a layer to your GIS map for power lines to see which locations may experience blackouts after a disaster, add a layer for gas stations to see in which locations people will struggle to find fuel, or even add a layer for wastewater treatment plants, which can be impacted by heavy rains or saltwater intrusion near the coast.
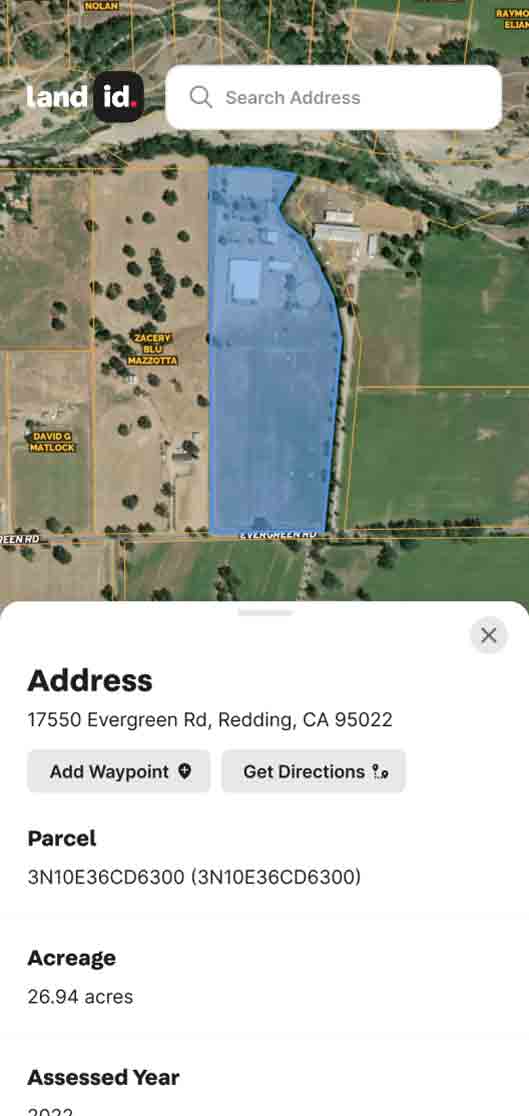
Managing Disaster Response With Land id®
Land id® (formerly MapRight) takes the complexity out of disaster response and management. With Land id®’s robust datasets, you can add a layer to your map for virtually anything that could potentially affect the impact of natural disasters – flood plains, substations, transmission lines, population data – you name it. By visualizing all of this data on one interactive map, patterns and trends become apparent, and prioritizing resources becomes far simpler.
Ready to tackle the next disaster head-on? Sign up for a 7-day free trial of Land id® today!
FAQs
Continue Reading
Craig Rowe
Can Refurbishing Schools Help Solve Housing Issues?
.png)
By Land id
Old public schools are becoming apartments as enrollment drops. See why school-to-apartment conversion is adaptive reuse's fastest-growing niche.

Craig Rowe
How Factory-Built Housing Can Reshape America’s Housing Market
By Land id
The U.S. housing industry’s decade-plus-long inventory challenge could see its first true sign of resolution should the 21st Century Road to Housing Act become law.


Explore Private Parcel Data & Property Boundaries
Download the Land id app and try for free.