Over the centuries, humans have shown that we have an insatiable thirst for exploring the land—at least the parts of the land that aren’t submerged underwater. The bottom of the ocean is a different story. Even today, with the benefit of sonar and radar technologies, the sea floor remains, for the most part, a mystery.
However, researchers are making great strides in the exploration of our planet’s last frontier, and since June is National Ocean Month, we thought it was the perfect time to learn more about how these areas are being mapped.
What Do We Know About the Ocean Floor?
We have a general idea of the topography of the seafloor thanks to gravity data gathered by satellites that scientists have been able to piece together, but its spatial resolution is only about two square miles. Topographic maps of Venus and Mars are about fifty times more detailed, by comparison. In order to truly get an idea of what the bottom of our oceans look like, we need to map out every canyon, plain, volcano, mountain range, trench, and underwater lake. When you consider that oceans cover approximately 70% of the Earth’s surface, though, you start to realize what a huge undertaking that is.
While the vast majority of the ocean floor remains unmapped by modern standards, in recent years, we’ve seen the percentage of mapped seafloor slowly tick up. In 2010, only about 5% of the ocean floor had been mapped using modern surveying techniques, but today, researchers have been able to map about 20% of the ocean floor.
However, many of the areas for which we have higher quality data are along shipping lanes or near high population centers. It’s much harder to explore the more desolate parts of the ocean that are far from land without prior justification. For example, the search for Malaysia Airlines Flight 370 contributed more than 100,000 square miles of newly mapped sections of the Indian Ocean once the search was concluded in 2014.
Bathymetry: The Science of Underwater Mapping
Before we had satellites or sonar technology, the only way to measure the depth of the ocean (or bathymetry) was with a sounding line. Basically, a weighted rope was lowered overboard until the tension in the rope slackened, signalling that it had hit the seafloor. Depth was then measured by how much of the line was submerged. This technique had many obvious limitations and was thankfully retired with the advent of sonar.
Invented in World War I, sonar (sound navigation ranging) measures distances by emitting a short pulse of high-frequency sound and measuring the time until an echo is heard. More recent sonars provide far more accurate data, particularly when multibeam echosounder sonars are used.
Whereas traditional sonar systems only produced soundings along a ship’s track, multibeam sonar produces a wide swatch of soundings. After first being used by the U.S. Navy in the 1960s, this technology was eventually declassified in the 1970s and allowed the scientific community to more quickly create maps of large areas of the sea floor. Today, modern multibeam systems can map swaths up to several times wider than the water’s depth.
Why Should We Map the Oceans?
You might be wondering if mapping the ocean floor is really that important—after all, we can’t even access most of it—but you’ll be surprised to learn that the bottom of the ocean has a huge impact for those of us on dry land. Understanding the shape of the sea floor helps us determine ocean circulation patterns, which affect climate and weather patterns, tides, wave action, sediment transport, tsunami wave propagation, and underwater geohazards. Furthermore, sea floor mapping will aid us in activities such as wave energy conversion, fishing and food supply management, and the construction of underwater infrastructure.
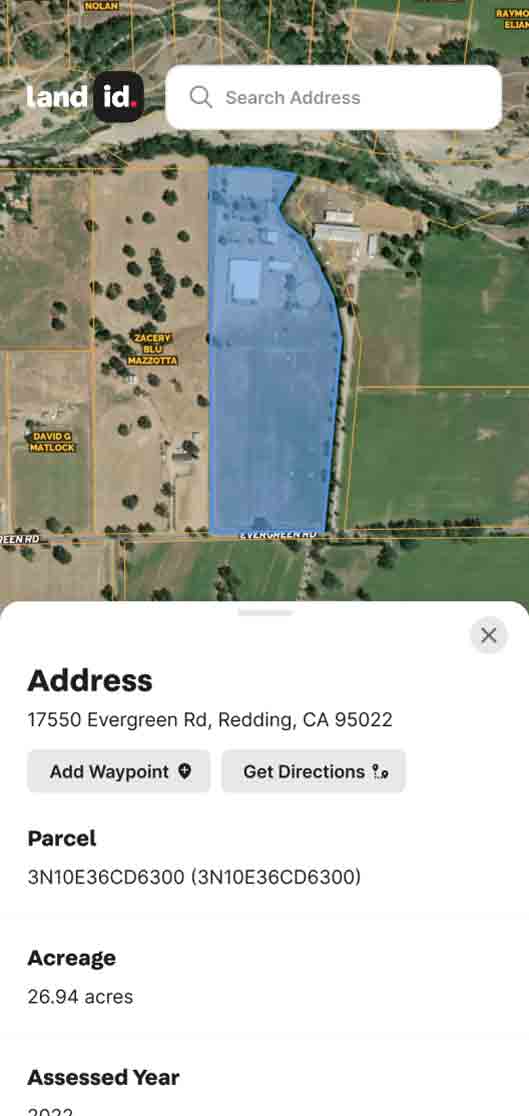
Explore the Power of GIS With Land id®
Of course, with only 20% of the ocean floor currently mapped, we have a long way to go before we have a complete picture of its topography. By comparison, it’s much easier to create maps of the land around you, especially with Land id® (formerly MapRight). Whether you’ve worked with GIS your entire career or you’re just beginning to see the value in geospatial technology, you’ll love how easy it is to make beautiful, interactive maps on our platform. With 40+ overlays to choose from, numerous styling and customization options, and your own creativity, there’s no one way to make a Land id map. To get started, sign up for our 7-day free trial today!
FAQs
Continue Reading
Craig Rowe
Can Refurbishing Schools Help Solve Housing Issues?
.png)
By Land id
Old public schools are becoming apartments as enrollment drops. See why school-to-apartment conversion is adaptive reuse's fastest-growing niche.

Prospecting, Part 2: Find Off-Market Properties
By Land id
Find off-market properties before your competition does. 8 proven strategies for real estate agents—from absentee owner lists to parcel data.
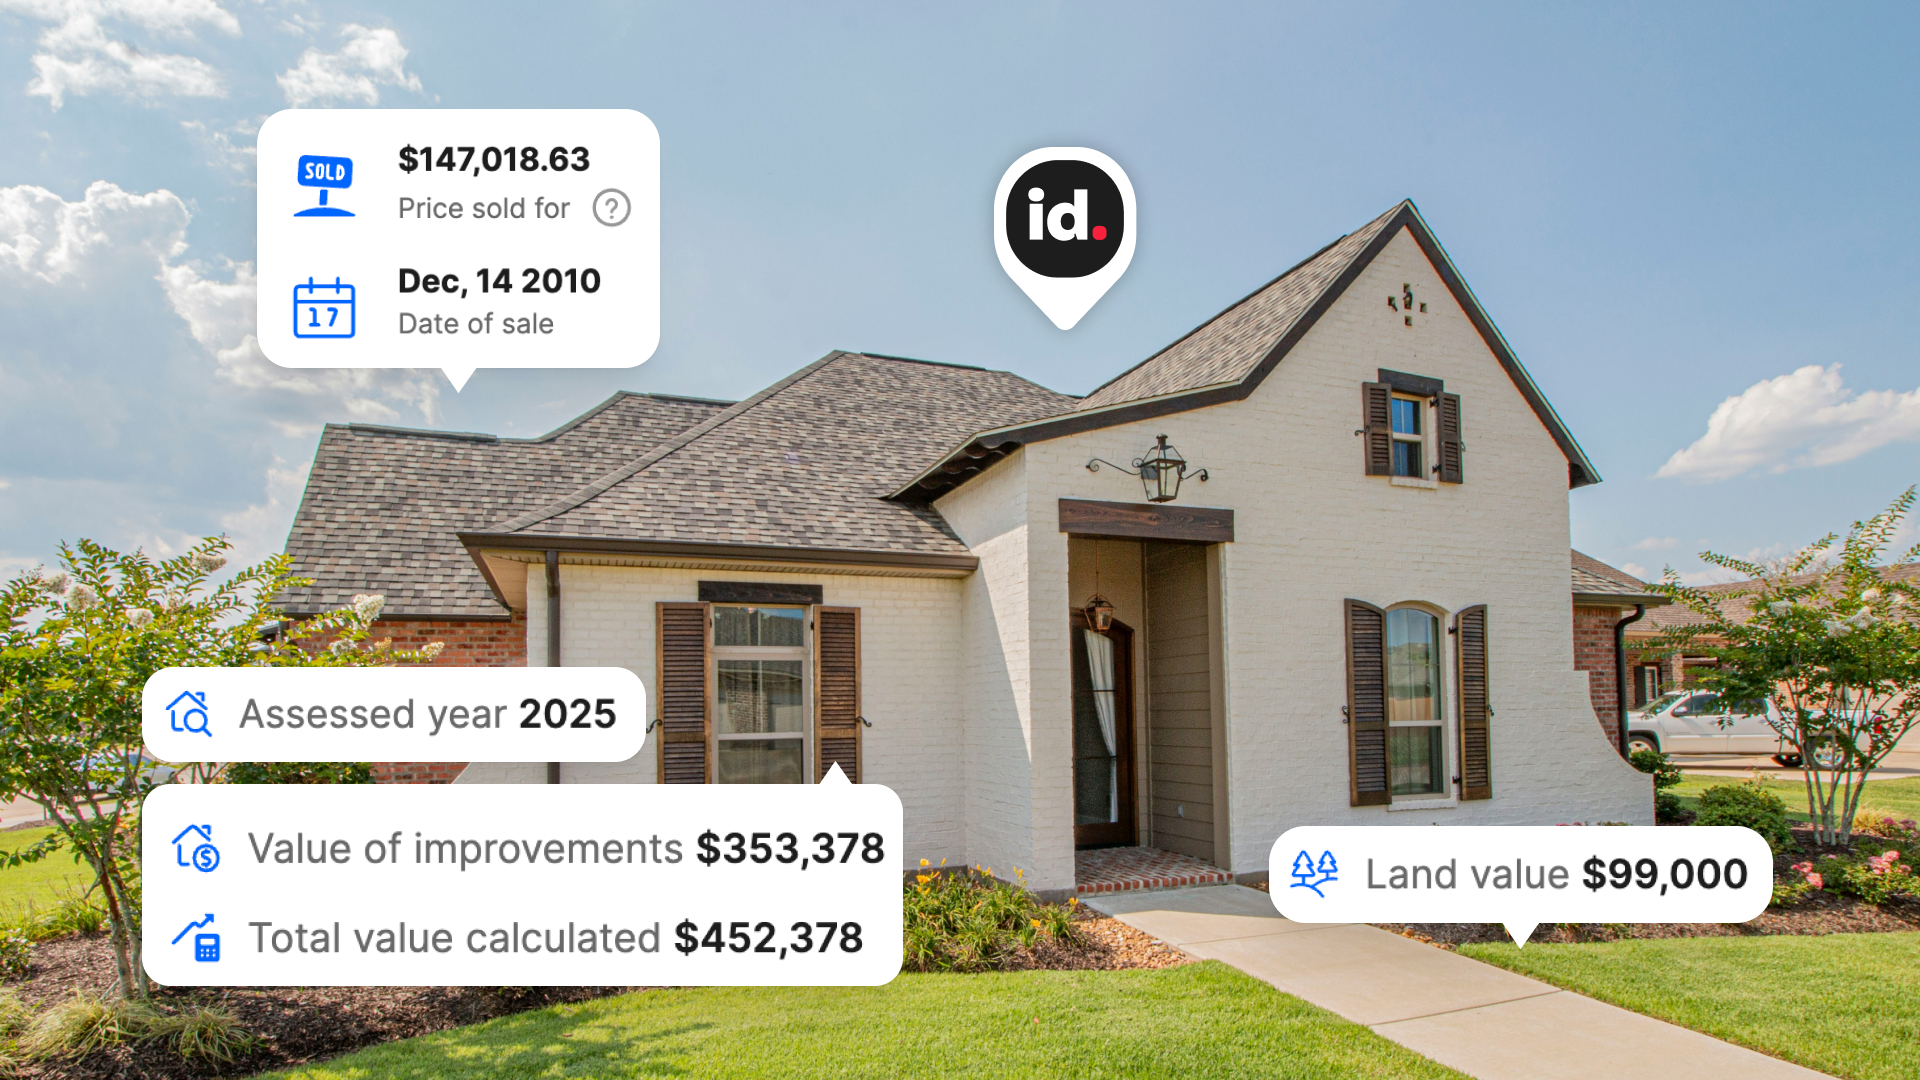
Explore Private Parcel Data & Property Boundaries
Download the Land id app and try for free.