We don’t typically think of trees as a critical part of a city’s infrastructure, but they are just as important as highways and electric lines. Inadequate tree coverage in a neighborhood results in much higher temperatures, poorer air quality and lower property values. That’s why many cities are taking steps to address tree inequality. By utilizing multiple geospatial datasets, conservation nonprofit American Forests created The Equity Score map to visualize tree distribution across the US. In doing so, the project found that in the poorest neighborhoods — where 90% of residents live in poverty — they have 41% less coverage than the wealthiest areas.
Mapping the Trees
According to American Forests, the Tree Equity Score measures how many trees are needed in each neighborhood (defined as Census Block Groups). They calculated this metric through analysis of tree canopy cover, climate, demographic and socioeconomic data. Below is an overview of their methodology
Step 1: First, tree canopy cover was measured using high resolution tree canopy imaging and the National Land Cover Database.
Step 2: Using generalized natural biome baseline targets selected in conjunction with the USDA Forest Service, the nonprofit selected a baseline target based on the location of each municipality. The canopy target for a grassland, for instance, is about 20%, but for a desert region, it would be only 15%.
Step 3: The canopy target is then adjusted based on population density to estimate a neighborhood goal.
Step 4: Once they know the adjusted canopy goal for each neighborhood, they subtracted the existing canopy from it to determine the neighborhood canopy gap.
Step 5: American Forests next considered income, employment, race, age, climate and health to create the Priority Index. This metric helps to identify the areas most in need of tree planting.
Step 6: Finally, they simply multiplied the neighborhood canopy gap score by the Priority Index to calculate the Tree Equity Score. A lower Tree Equity Score indicates a greater priority for closing the tree canopy gap.
American Forests gathered all of their data into a map you can view here.
GIS Grows Future Prosperity
This analysis of tree inequality has revealed the extent of the issue. Nationally, some 522 million new trees are needed for every city to reach a score of 100, which may sound daunting, but with the Tree Equity Score map, we’ll know exactly where these new trees need to be planted. Planting so many trees could also lead to the creation of more than 3.8 million jobs, curb air pollution by 56,613 tons of particulates each year and remove 9.3 million tons of carbon from the atmosphere.
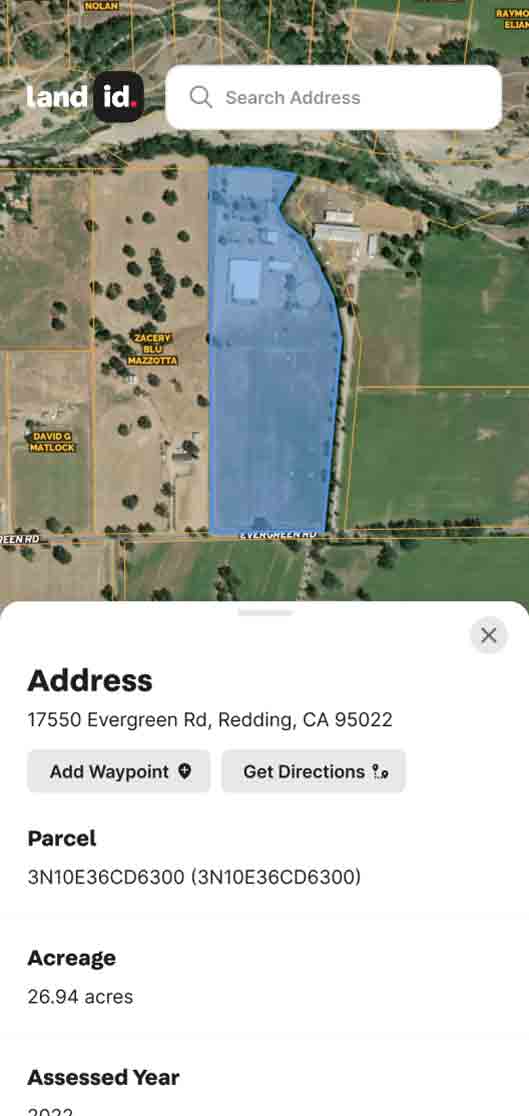
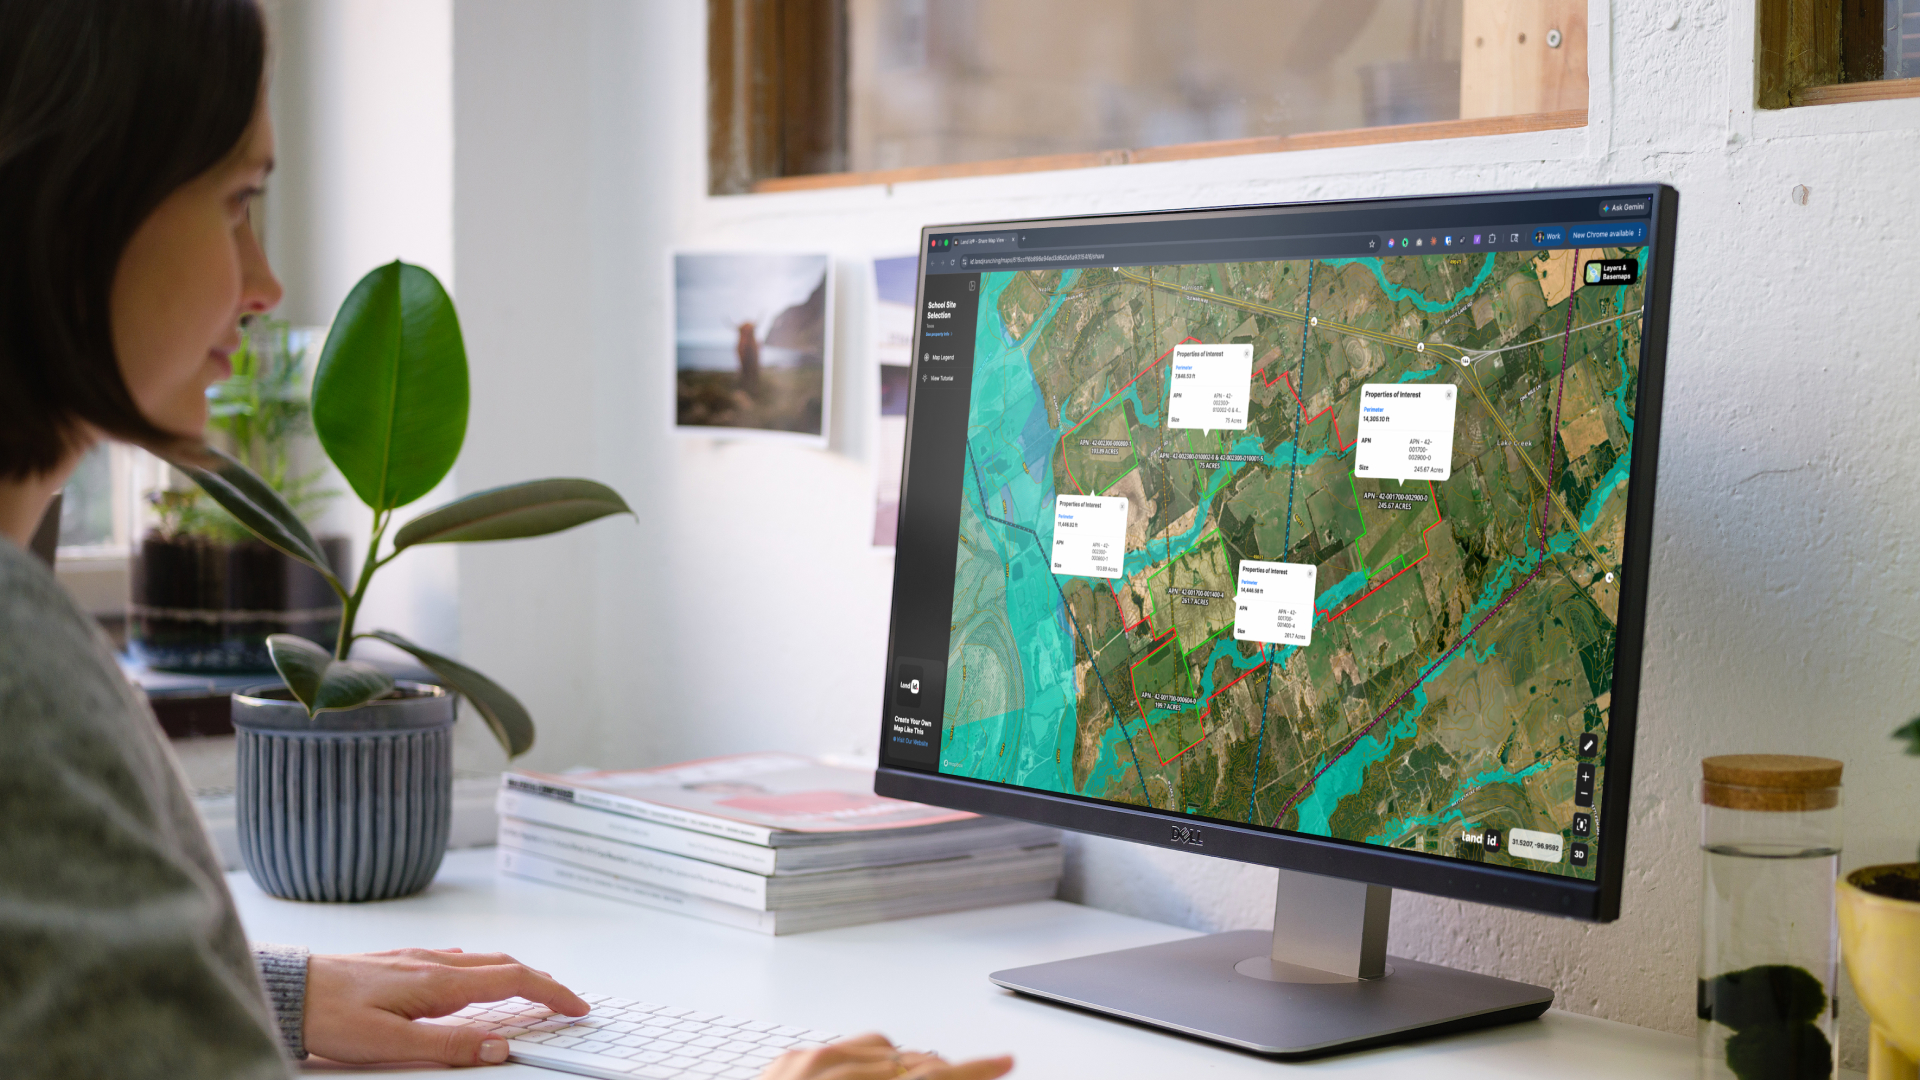
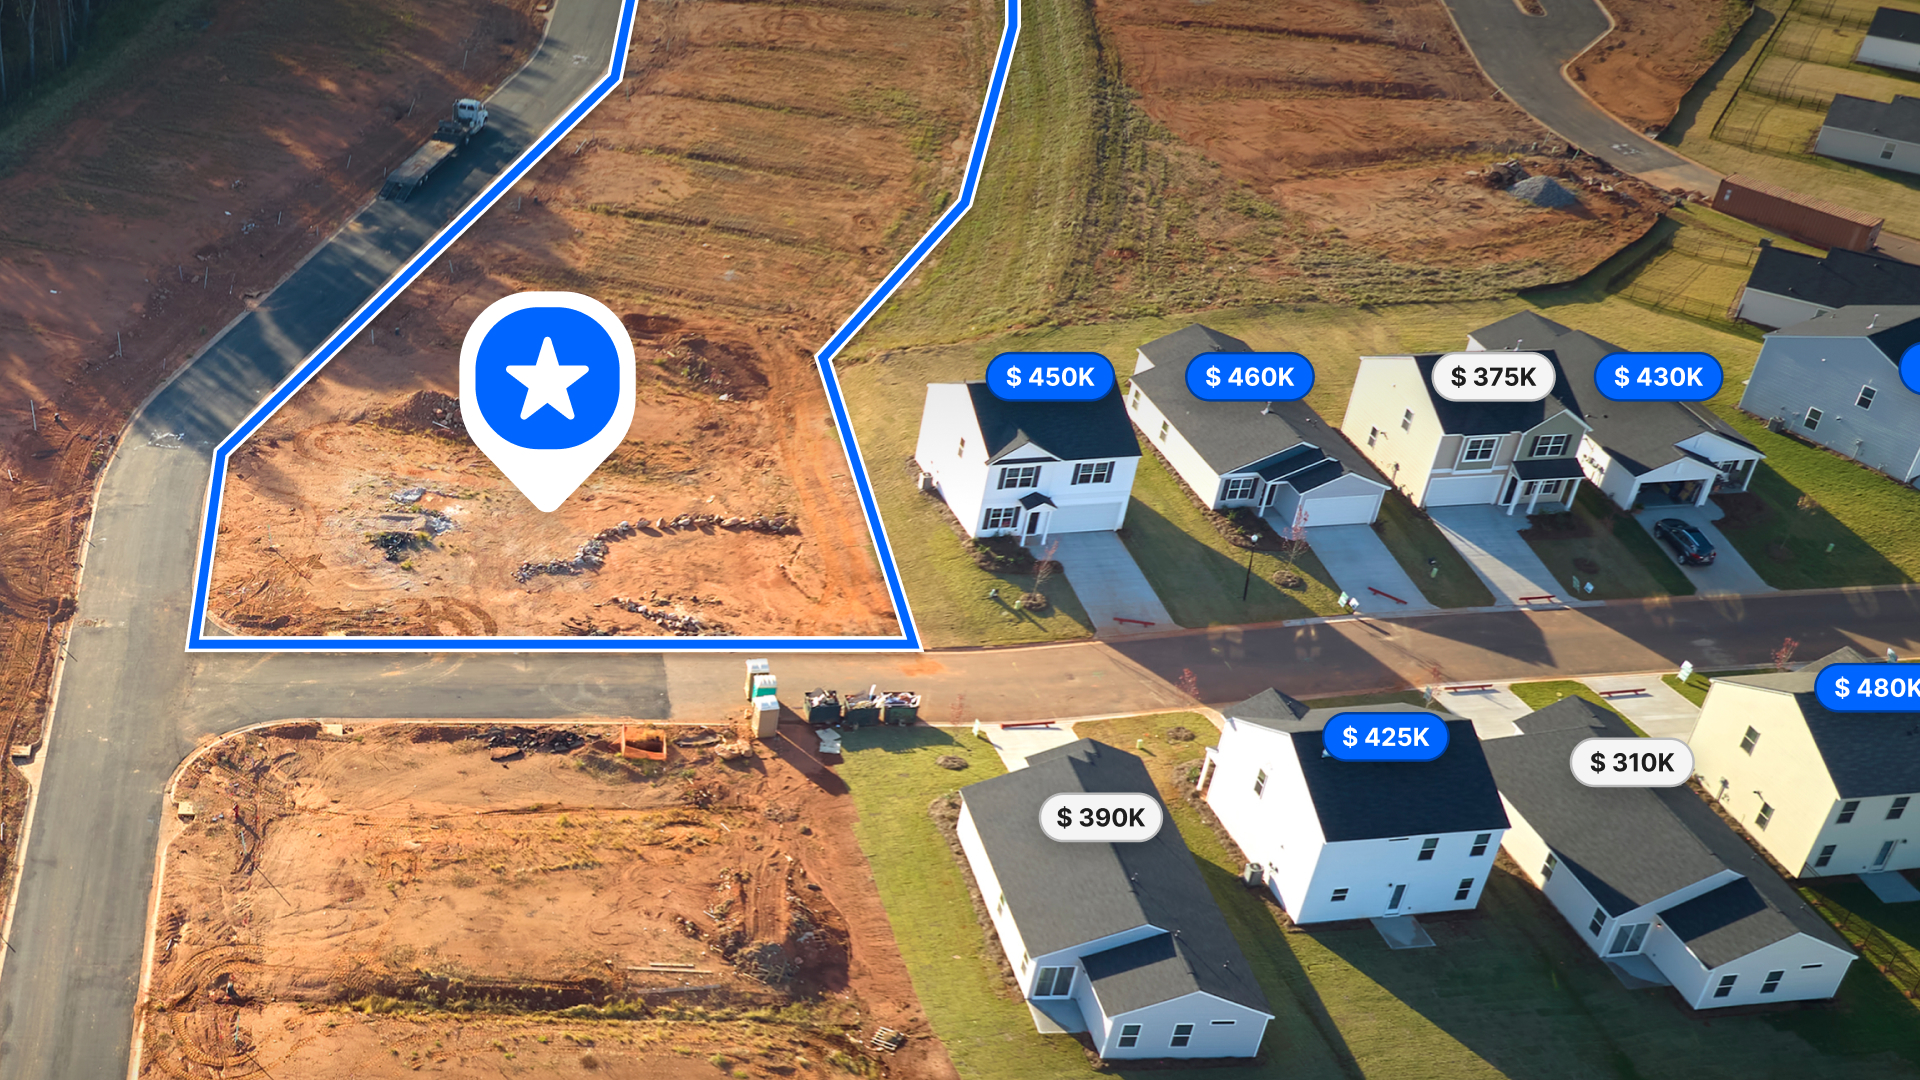
The Tree Equity Score project is an excellent example of how, with the right data and GIS technology, we’re not only able to learn more about the world around us, but we’re able to visualize and share that information with others. If you’re searching for a better way to show off the land and all of its attributes, Land id’s (formerly MapRight) mapping software is a good place to start. Our web and mobile app features seven different GIS base layers, two dozen Land id® layers and countless styling and customization options.
Whether you work in real estate, engineering, agriculture, forestry, energy or government, our platform makes it easy to create data-packed, interactive maps that you can share with anyone. To see what Land id® is capable of, sign up for the 7-day free trial today, and make your first map in minutes.
FAQs
Continue Reading
Craig Rowe
Prospecting, Part 3: Find Land Faster
.png)
By Land id
How real estate investors and developers can use Land id to discover and analyze land-buying opportunities in less time.
How to Price Land for Sale Using Comparable Sales Data
By Land id
Learn how to price land using comparable sales. Find, analyze, and adjust vacant land comps to price listings accurately and sell with confidence.

Explore Private Parcel Data & Property Boundaries
Download the Land id app and try for free.