Maps are used in many scenarios to help us visualize the relationship between geography and other variables such as average temperatures, bird migration patterns or relative elevation. These maps have to be developed, though, using multiple datasets and careful attention to detail. Every ten years, Americans get a front row seat to a real world application of map-making using data collection and analysis that has an impact on all of us in one way or another: the process of redistricting.
The US Census and Redistricting
Every decade, a census must be performed to count the US population, and with this data, states are required to redraw legislative and congressional districts. There are two processes involved:
Reapportionment: The federal government uses census data to reallocate congressional districts among states to account for shifts in population. This is why you hear about states gaining or losing seats every decade.
Redistricting: States are required to redraw district boundaries to ensure districts are of equal population.
While reapportionment only applies to congressional districts, all representational bodies that use districts are required by federal law to redraw boundaries following a census. This includes local governments and some judicial districts.
The Criteria for Redistricting
The state legislatures or commissions that are responsible for drawing districts are provided with certain criteria by which they can draw them. This criteria can allow or disallow the inclusion of different datasets. By federal law, there are two mandatory criteria every state must follow:
- The Equal Protection Clause of the 14th Amendment: requires that districts be substantially equal
- The Voting Rights Act of 1965 mandates that redistricting not intentionally or inadvertently discriminate on the basis of race
To help meet the Equal Protection Clause, the Redistricting Data Program provides states with decennial population totals for geographic areas specified by the states. A few states use emerging criteria that calls for more competitiveness in districts and the prohibition of partisan favorability.
The Data
While the Redistricting Data Program makes census data available for states in districting, only 21 states explicitly require it. Supplementary datasets can include additional information on demographics, registered voters or voter age population numbers.
Oregon, for example, requires by law that districts be connected by transportation links which calls for data regarding transportation infrastructure to be considered during redistricting. A few states, such as Iowa, have even prohibited the use of certain partisan datasets including election results, party registration and socio-economic data from being used.
These are just a few examples of the ways different datasets are utilized and applied during the process of redistricting. The increased use of GIS by legislatures and commissions also means they’ll be able to incorporate more complex datasets in the future, improving the accuracy of the boundaries drawn.
Utilize the Power of Map-Making
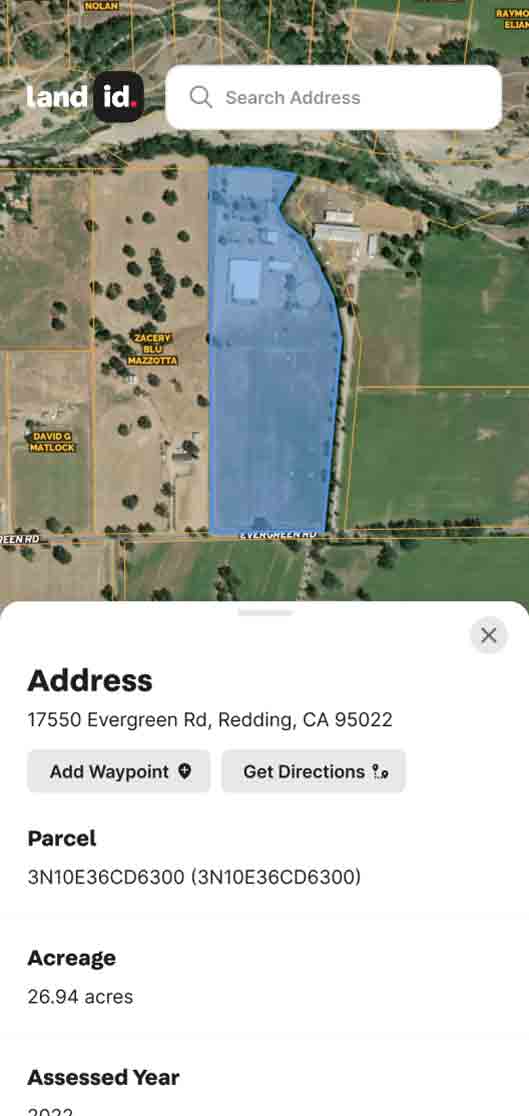
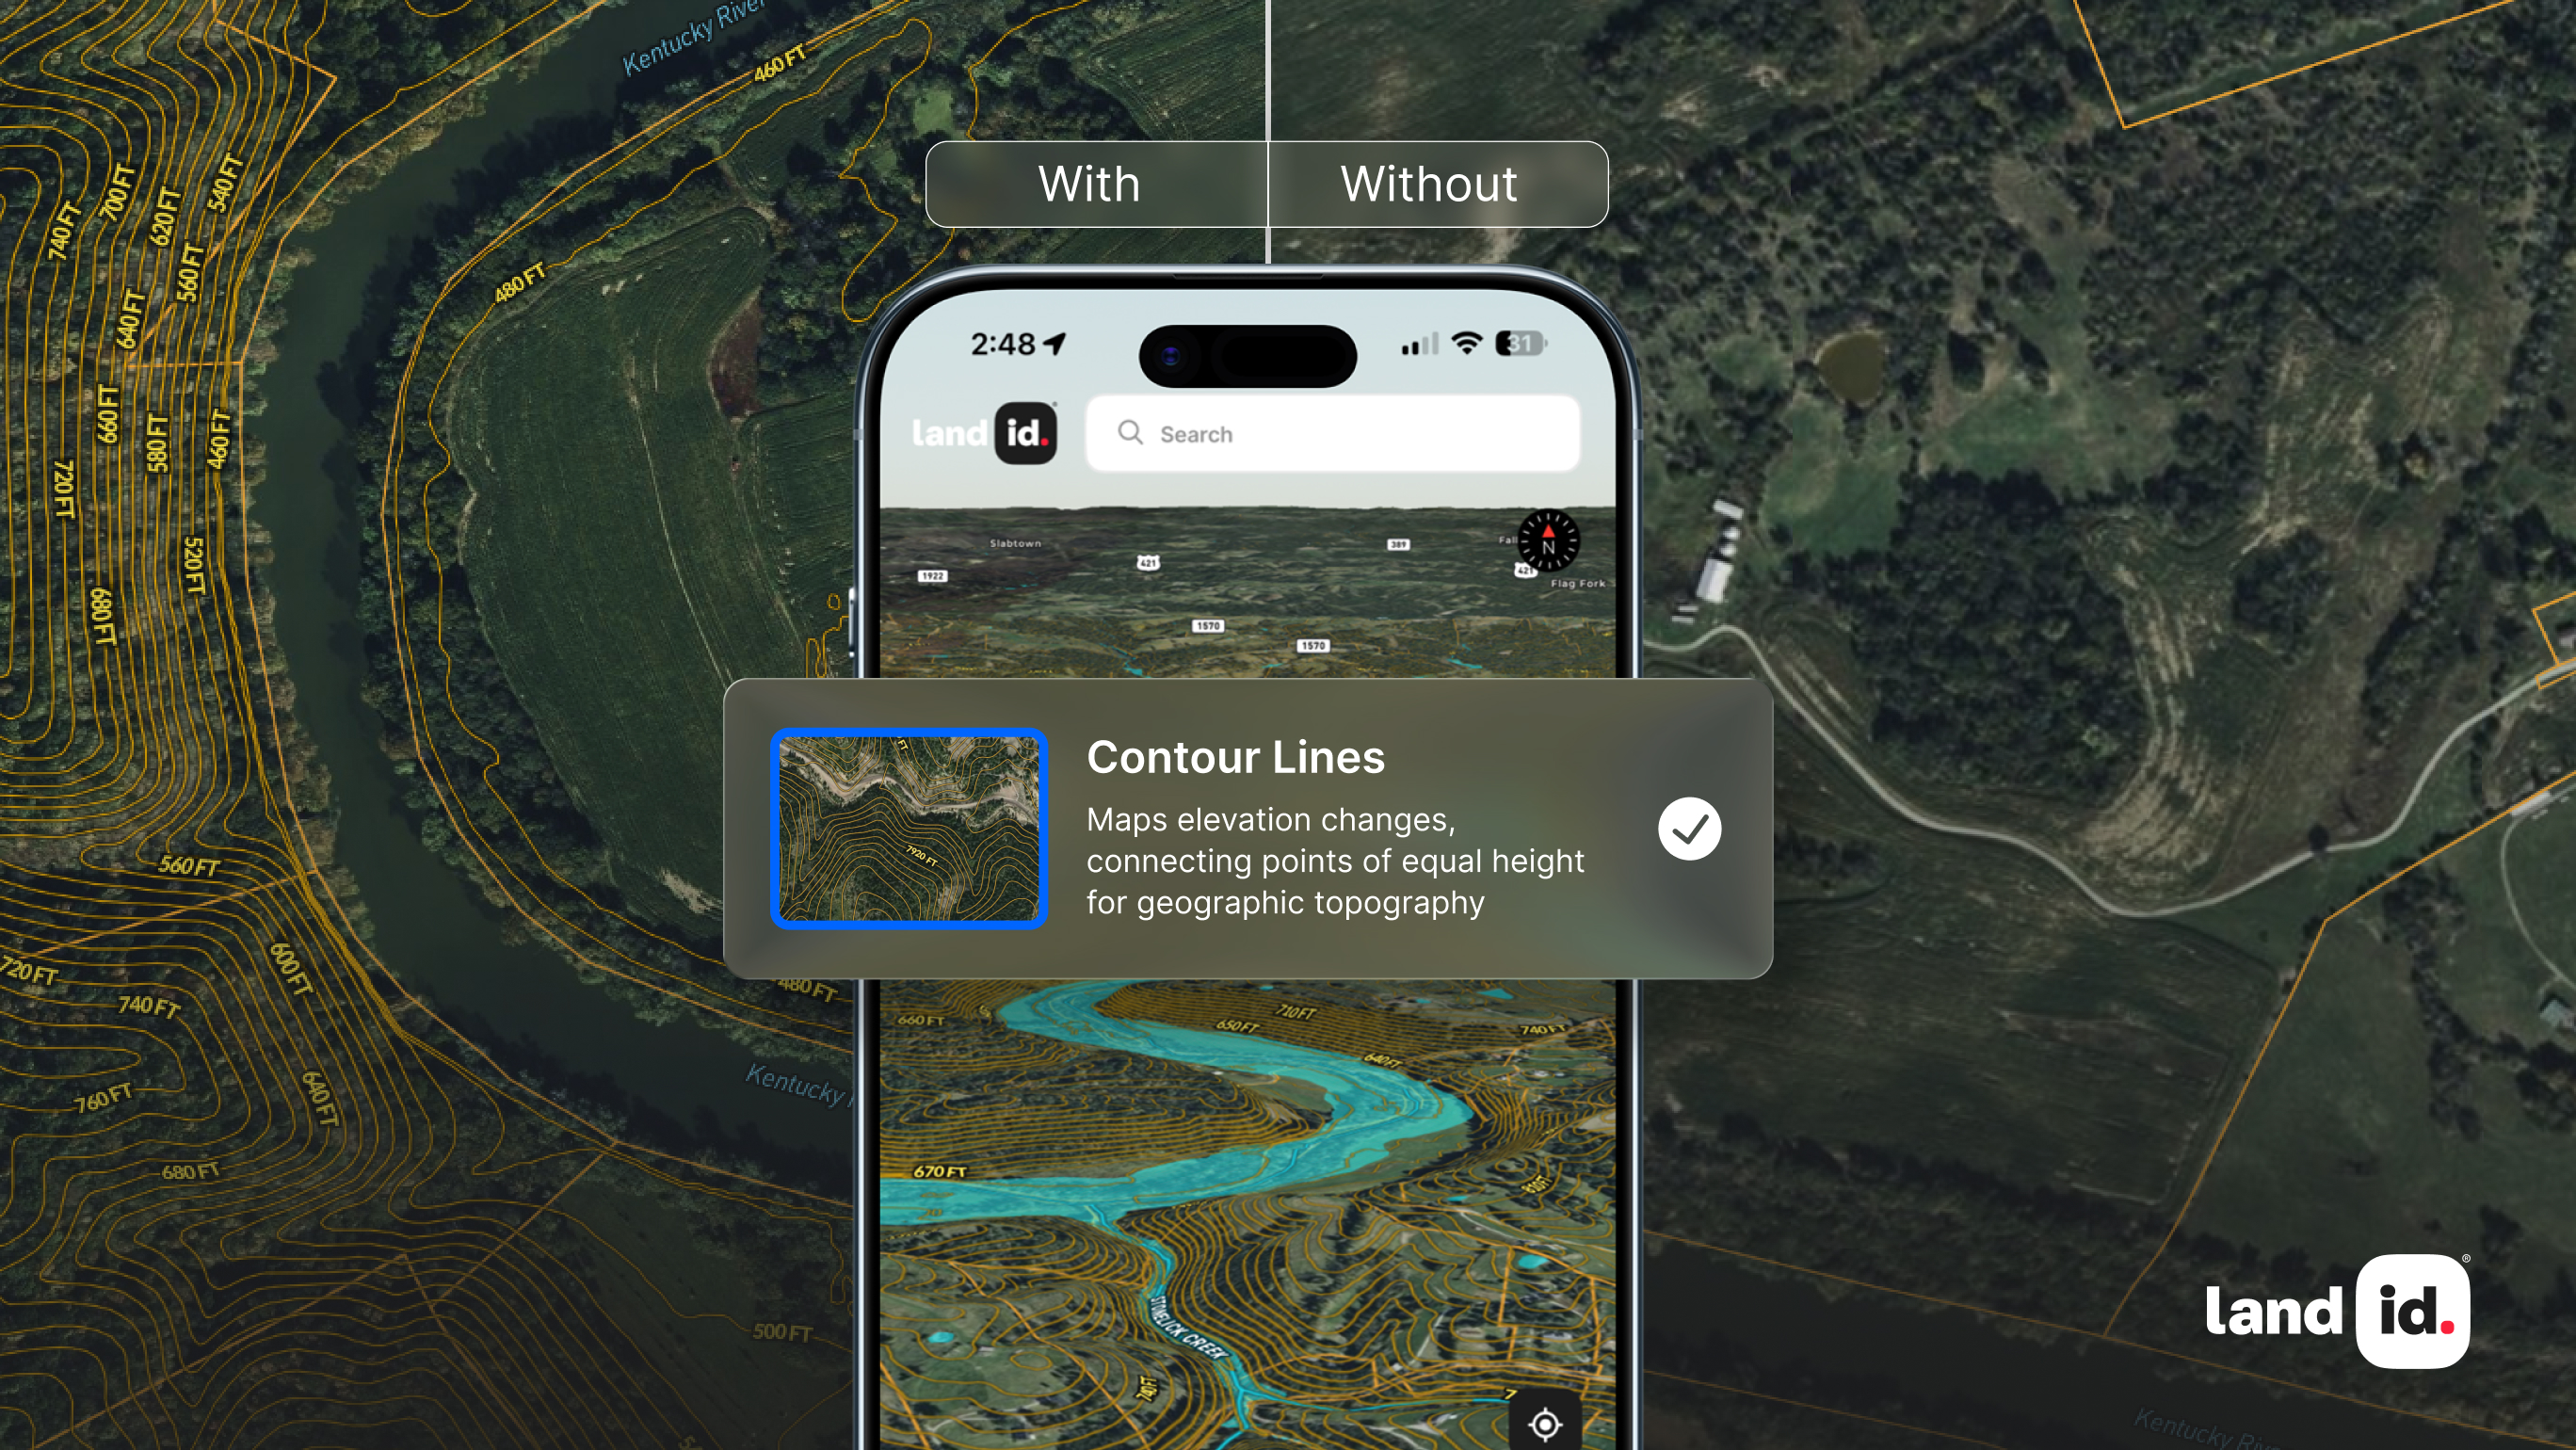
GIS is a powerful tool, capable of doing everything from helping lawmakers draw political districts to allowing realtors to share the unique qualities of property. The map you make is only as good as the data you have and the technology you use, though. If you’re ready to make maps that can speak for themselves, start a free trial of Land id® (formerly MapRight) today.
FAQs

Continue Reading


