Geographic information systems (GIS) are amazing tools that help us visualize our world in new and dynamic ways, but this technology would be little more than simple static maps without data. It’s the incorporation and layering of this data geospatially that makes GIS more than a simplistic, rudimentary map making tool. Only when you understand the role of data in GIS can you harness this technology for your own unique pursuits.
“Data” is a slippery term, though. What types of data are used in GIS? Where do these datasets come from? And, how can they be used?
Types of Data
There are many different types of data, but for the purposes of GIS applications, most data comes in the form of vector or raster formats.
Vector Data
Vector data is essentially a list of x,y coordinates. These high-fidelity graphics don’t consist of grids of pixels like an image, but vertices and paths. Because of this, they are infinitely scalable without losing quality, but you can’t produce vector graphics with a camera. This kind of data requires a computer program such as Sketch or Adobe Illustrator to be created and edited.
Vector data consists of three basic components: points, lines and polygons. In GIS, these components help to illustrate a variety of features.
- Points: are basically one x,y coordinate. On a map, a vector point may represent a city, a mountain peak, a trailhead and other points that are too small to be drawn to scale.
- Lines: are a series of connected vector points in which there is a distinct start and end point. Vector lines will also never intersect with itself. On a map, lines can delineate things like roads, rivers, railroads and other pathways.
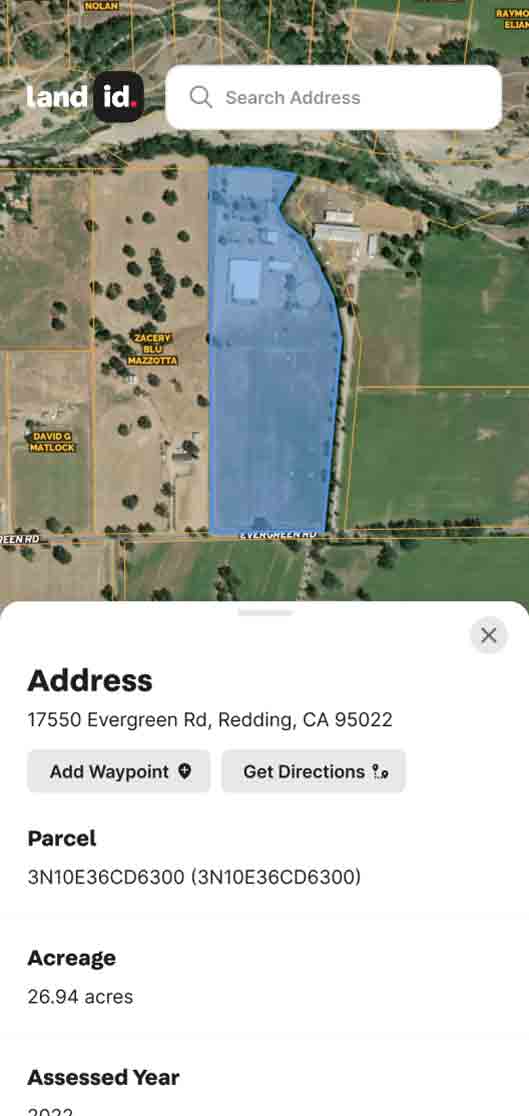
- Polygons: are inclosed areas. The boundaries are made up of vector lines in which the first and last point are the same, forming a shape. On a map, polygons can be used to indicate county lines, state borders, parcel boundaries, bodies of water and more.
Several different file types can store vector data in GIS applications, but Shapefiles are by far the most common. This file type was originally developed by ESRI, and is now industry standard. All commercial and open-source applications accept it. You need three files to make up a Shapefile: SHP is the feature geometry, SHX is the shape index position and DBF is the attribute data.
Other vector file formats include Geographic JavaScript Object Notation (GeoJSON), which is mostly for web-based mapping, Google Keyhole Markup Language (KML/KMZ), which primarily used for Google Earth, or Digital Line Graph (DLG), which the US Census Bureau uses to generate Topologically Integrated Geographic Encoding and Referencing (TIGER) data.
Raster Data
You likely see raster data everyday if you look at photos. This data is grid and pixel based and comes in formats with recognizable names such as JPEG, PNG and TIFF. Raster data in GIS is commonly used to record aerial surveys, satellite imagery and topographic maps. Essentially, raster data contains the surfaces of maps that vector data can be overlaid on top of using GIS tools.
Unlike vector data, raster data cannot be scaled larger or smaller infinitely without suffering a loss of quality. Eventually it will become blurry or pixelated. However, raster data does provide more detail than vector data since it’s more comprehensive than points and lines.
Raster data in GIS imagery has pixels associated with a value (continuous) or class (discrete).
- Discrete raster data: can only take distinct values. Think of maps that color-code each state in the US based on a value such as average annual traffic accidents or a characteristic such as legalization of cannabis. These maps are using discrete raster data.
- Continuous raster data: can take any value within a range. Continuous data has more gradation than discrete data and is used to display changes in values such as temperature, population density or rainfall.
GIS raster data can be stored using several different types of file formats such as GeoTIFF, which is an industry image standard file for GIS and satellite remote sensing applications, IDRISI Raster files that consist of numeric grid cell values as integers, real numbers, bytes and RGB24, or ERDAS Imagine (IMG) files, which are commonly used for raster data to store single and multiple bands of satellite data.
Data Sources
Mapping data can come from many different places, allowing you to geospatially visualize a variety of different ideas and concepts. You’ve just got to know where to look.
Open-source data sources: You can find an incredible amount of GIS data online and freely available for you to use. Databases include places such as Natural Earth Data (NED), an open-source GIS database supported by the North American Cartographic Information Society. Since NED is in the public domain, you’re allowed to use, modify and share the data however you’d like.
Other open-source databases include OpenStreetMap Data, which is crowdsourced by cartographers and map makers, or the ESRI Open Data Hub, which has over 250,000 open datasets from over 5,000 organizations.
Governments: Local, state and federal government agencies maintain geographic databases of their own, and much of this data is available to the public. Depending on the location and the types of data you are interested in, you have appraisal offices at the local level that keep record of parcel data, state agencies responsible for managing transportation, water and other resources, and federal agencies such as NASA, USGS or USDA that compile their own data.
For instance, the USGS EarthExplorer is the most comprehensive free source for remote sensing data. And, NASA’s Socioeconomic Data and Applications Center (SEDAC) visualizes how humans interact with the environment, including in-depth information about global population and demographics. Land id® (formerly MapRight) even uses some open-source datasets on our platform such as FEMA’s mapping of floodplains or the USDA National Research Conservation Service’s soil survey data.
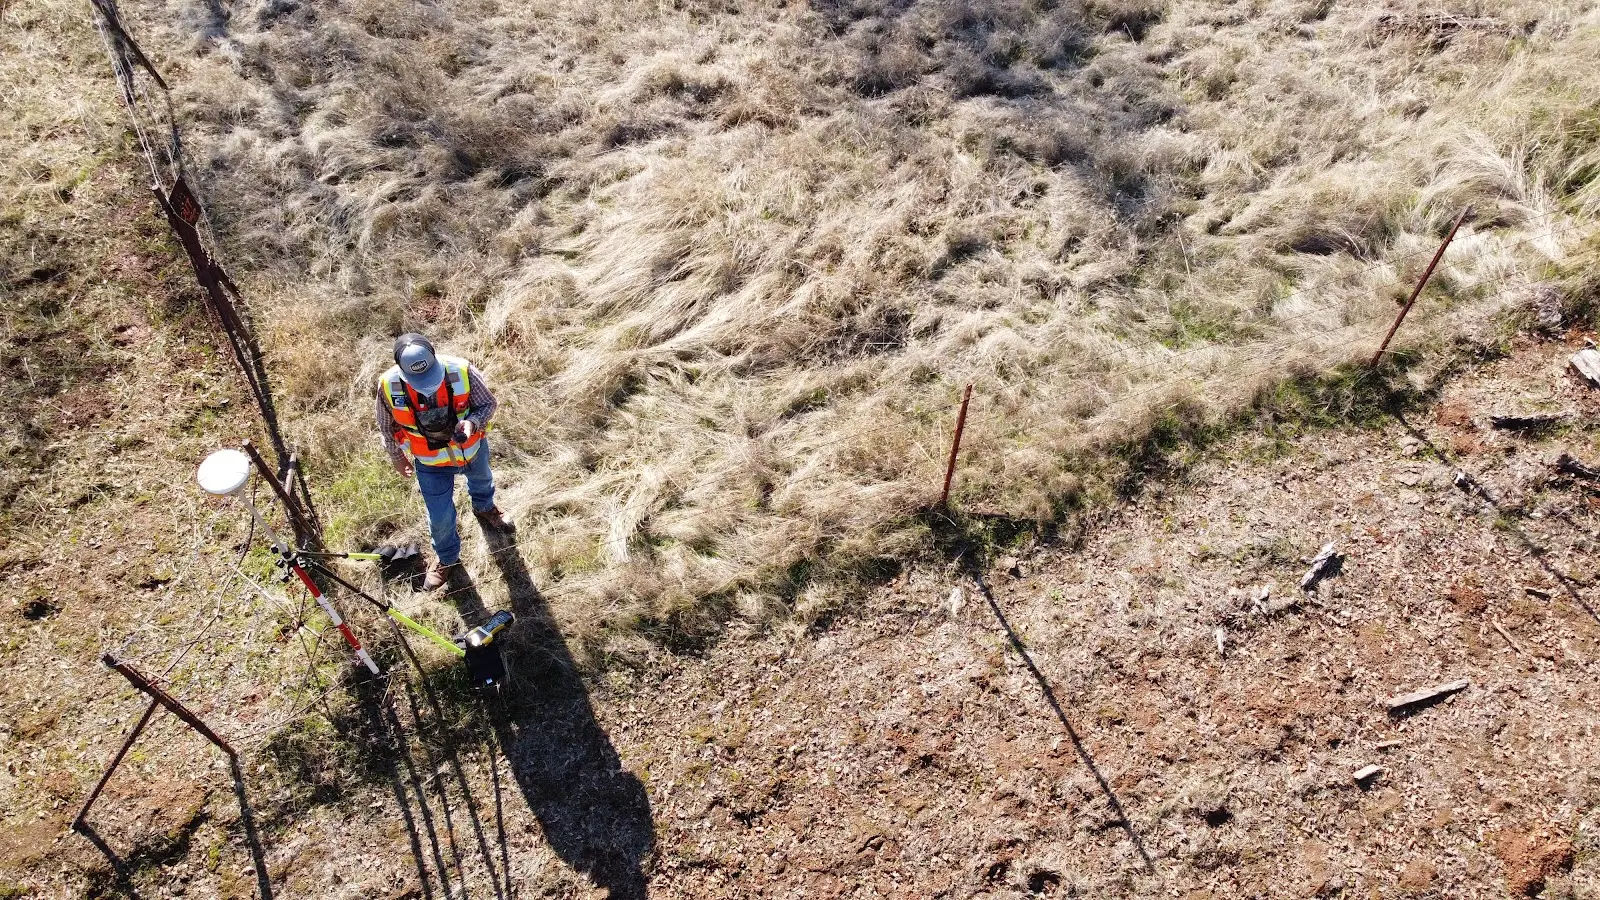
Proprietary data: GIS data can also come from you and your unique projects. Depending on your specific needs, you have the ability to record data on timber stands, similarly appraised properties, grazing cycles and more. With the right GIS tool, you can easily map this data to visualize it more effectively.
Land id®: Powered by Data
Understanding the role data plays in GIS applications is one thing. Harnessing the power of data in GIS to streamline your mapping activities is entirely another undertaking. Even when you know your way around file formats and data sourcing, it’s still difficult to access and make sense of all of this information.
Land id® provides our users with an easy-to-use GIS platform that consolidates data sources, synthesizes and corrects them to make them easier to view and combines and organizes different types of data into a single, interactive map. It’s easy to show school districts alongside floodplains or public land boundaries alongside soil type, all at once. On any Land id® map, you even have the ability to create custom geographic databases, allowing you to analyze anything from comparable sales data to the location of substations.
Instead of wasting time and money trying to find and make sense of data sources individually, let Land id® consolidate them all into one place for you. Sign up for a 7-day free trial to experience the power of data in GIS for yourself.
FAQs
Continue Reading
Craig Rowe
5 Real-World Land id Workflows Worth Borrowing
.png)
By Land id
See helpful examples of how real estate pros use Land id to win listings, market properties, plan developments, and make smarter data-driven decisions.

Alyssa Toohey
Off the Map & In Person: The Land id Team Gets Together

By Land id
The Land id team came together in Montana for collaboration, connection, Big Sky views, PBR, Yellowstone, and plenty of memorable moments.

Explore Private Parcel Data & Property Boundaries
Download the Land id app and try for free.